


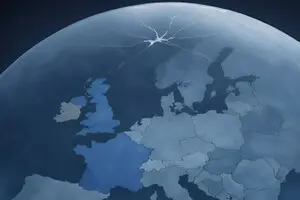
France and Britain Instead of the US? Five Scenarios of Nuclear Autonomy for Europe
Global Crisis: Why Markets Don’t Believe in It—And What Happens When They Do
17 march, 2026, 11:30
Share


The war in the Middle East is the starting point for a cascading destruction of global financial markets.
Within the system of unequal global exchange of fiat reserve currencies for real material resources, each Western global cluster has had its own source of compensation for “embodied energy.”
“Embodied energy” means both direct energy supplies and supplies of semi-finished and finished goods in which energy previously expended in other countries is already “embedded.”
As a rule, Western countries leave the Global South not only the “dirty” industries, but also the most energy-intensive ones.
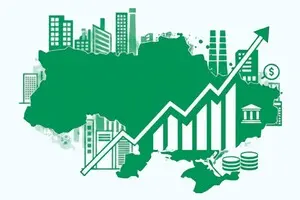
For example, when Ukraine supplies metal to the European Union, it is, in essence, selling iron ore and “embodied energy” in the form of that semi-finished product.
The two largest Western clusters had two suppliers of “embodied energy.”
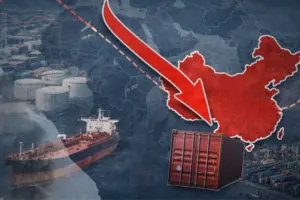
For the EU, before the full-scale war, that supplier was Russia (oil and gas), while for the US it was China (finished goods whose production had already consumed energy).
Now, for the West to produce energy-intensive goods at home, it needs domestic “embodied energy”—preferably cheap and available in sufficient volume.
That is why Trump is partly abandoning the “green deal” and launching a “Drill, baby, drill” program, betting on fossil fuels—oil and gas.
ВАС ЗАИНТЕРЕСУЕТ
The search for “embodied energy” in the EU will be more difficult. One partial solution is the recognition of nuclear energy as “green,” something EU leaders have already begun to discuss.
The current model of world economic development shows that the winners in competitive struggle are precisely those global clusters that secure access to energy resources for their economies on the basis of two main parameters: affordable prices and the availability of the necessary energy volumes.
If one of those two parameters is missing, the model of global economic growth begins to slide into crisis.
At present, there are four global development clusters in the world:
- the American one, comprising the US, the UK, Canada and Mexico;
- the European one, e., the EU;
- the Asian one, including China, Japan, India, Korea and Indonesia;
- the Latin American one, built around Brazil, Argentina and Chile.
So far, only the American supercluster has an energy surplus in its overall energy balance, while the European and Asian clusters are deeply deficit-ridden.
Latin America is hovering around a zero balance, with a tendency towards surplus.
Thus, Asia and Europe essentially face the same task: increasing their access to cheap energy resources in sufficient volumes and at competitive prices. Otherwise, they will be hopelessly outcompeted by the American supercluster. More than that, the perennial outsider in this quartet—Latin Americans—will begin breathing down their necks.
If one looks at the structure of the global energy balance, the Asian cluster has the largest gap between energy consumption and energy production within its regional energy balance—1,800–1,900 Mtoe (million tonnes of oil equivalent). Europe comes second, at 800–900 Mtoe. Taken together, these two superclusters require imports of up to 3,000 Mtoe. Who can provide that?
There is little reason to place hope in the Pacific region, Africa or Latin America. They account for free volumes of around 300 Mtoe each (the Pacific region, chiefly Australia; and Africa), along with 50 Mtoe in Latin America.
Among the largest suppliers, the Middle East occupies a leading place with more than 1,100 Mtoe, while the CIS countries provide up to 800 Mtoe (mainly Russia and Kazakhstan).
The European Union is abandoning imports of Russian energy resources because of sanctions and the EU’s position on Russia’s aggression against Ukraine. But now, as a result of the war, Brussels is also being cut off from Middle Eastern resources. In other words, Europe is losing global energy sources amounting to up to 2,000 Mtoe. North America’s potential (300–350 Mtoe) only partly cushions the problem and does not solve it (Canada contributes 250 Mtoe and the US up to 100 Mtoe).
The Iran factor alone amounts to a deficit of up to 80 Mtoe. Europe’s key internal energy base today is Norway, with 180 Mtoe. Purely in theory, Europe could redirect all the free resources of Australia, Canada, the US, Algeria and Nigeria towards itself. Taken together, that would create supply at roughly 800–900 Mtoe.
Those volumes would cover Europe’s needs, but would expose the deficit in Asia, whose markets are supplied with energy resources by Canada, Australia and, partly, the US. Russian supplies would also be redirected there.
And this is without taking into account distortions in the structure of domestic energy-balance indicators, where adequate oil supplies may coincide with shortages of coal, uranium or natural gas.
Notably, both Europe and China have almost identical deficit levels, slightly above 800 Mtoe. Naturally, China will lay claim to Russia’s energy surplus standing at 680–700 Mtoe.
Within the global energy balance, if the Strait of Hormuz is blocked for a prolonged period, someone will have to go without oil—either Asia or the EU. More precisely, both clusters will suffer because competition for energy resources will be resolved through a dynamic price equilibrium at a higher level (above $100 a barrel if the war drags on).
One can draw up a list of countries with the largest energy deficits (in Mtoe):
- China — 800;
- Japan — 350;
- India — 320;
- South Korea — 240;
- Germany — 190;
- Türkiye — 120;
- Italy — 115;
- France — 110;
- Taiwan — 105;
- Spain — 90;
- Thailand — 70;
- United Kingdom — 60.
It is precisely this palette of energy deficit that colors the globe in the shades of a possible global crisis.
The trigger works roughly like this: an energy deficit drives up energy prices, which fuels global inflation, which in turn produces a cost shock, leading to a global recession, social crises, then political crises and global destabilization.
The list above contains the countries that may be the first to find themselves on the brink of a crisis. But it is obviously not limited to them alone.
As for a cluster-based description of the cascading crisis, it could begin with the ASEAN countries, which are the most dependent on Middle Eastern oil. The crisis could then spread to India and South Korea, Taiwan and Japan. Crisis symptoms in China cannot be ruled out either. The wave would then proceed to reach the EU.
The cumulative effect of the crisis would also hit the US through the shallowing of liquidity flows on the American stock market (shares and risky financial instruments).
ВАС ЗАИНТЕРЕСУЕТ

The first wave of the energy crisis would inevitably be followed by a second wave: a food crisis. Through the cost of fuel and mineral fertilizers, the energy crisis also affects the global food market (this may result both in rising prices and shortages of certain crops, such as soyabeans).
How are global markets behaving now? Here, depending on internal trends, we will take either weekly or monthly timeframes. In recent days, India’s NIFTY 50 index has fallen by 2.47%, slipping when oil was expected to hit $100 a barrel and rebounding on news of oil at $80. It is now falling again. Japan’s Nikkei has fallen by 1.44% and is now trading sideways. The Philippine PSEi index is in the same condition, down 0.89 percent. Indonesia’s stock index, measured over a one-month horizon, has shrunk by almost 6 percent. Saudi Arabia’s key stock index is down 3 percent over the month, though it has partly recovered on news of oil exports through Red Sea ports. Britain’s main stock index has fallen by 1.12 percent over the month, with the decline accelerating since 1 March. Germany’s stock index has dropped by 5.1 percent over the month, with the steepest drop also occurring in early March. Thailand’s index has declined by 2.9 percent over the month. The key global index, or broad-based US index, the S&P 500, has seen a 2.4 percent drop over the month.
As we can see, the behavior of stock indices across the key geopolitical clusters that lie in the risk zone is very similar. Over either a week or a month, they are all falling within a range of between 0.9 and 5 percent.
In other words, markets are, on the one hand, sensing crisis, yet on the other still do not quite “believe” in a prolonged one.
Why is this happening? The situation resembles the behaviour of markets during the unfolding of the pandemic crisis in 2020. Market dynamics then developed in three sharply defined stages:
- Markets “do not believe,” but brace themselves (taking the US stock market as the basic model): the S&P 500 even rose by 3 percent between 30 January and 19 February 2020.
- A sharp fall between 19 February and 23 March 2020, amounting to 34 percent.
- A market recovery of 40 percent, beginning on 23 March 2020. The upward trend continued until 2022.

In other words, markets first “did not believe,” then “took fright” and finally “calmed down.” But that calm came against the backdrop of the Federal Reserve cutting its benchmark rate to almost zero and President Trump, in his first term, signing the Coronavirus Aid, Relief, and Economic Security Act (CARES), which provided economic stimulus worth $2 trillion.
The point is that the last pandemic on such a scale took place during the Spanish flu of 1918. In other words, the market had “forgotten” how to process analytically models of crises of this kind. But in much the same way, the market has also lost its reflexes for assessing large-scale energy crises.
The last such major crises occurred in 1973 and 1979. In 1973, against the backdrop of the Yom Kippur war, Arab countries imposed an oil embargo on the US and its allies. Oil then rose in price from $3 a barrel to $12.
In 1979, oil prices surged amid the Islamic Revolution in Iran.
These oil crises brought about structural global changes: inflation in the US and the “Volcker recession”, a shift away from large, fuel-hungry American cars towards Japanese ones, and the development of oil production in America and the Middle East, above all rising output in Saudi Arabia.
However, in 1990 a different set of reflexes was formed regarding crises in the Middle East: during the US war with Iraq to liberate occupied Kuwait, global markets, by analogy, expected a sharp rise in world oil prices, but this did not happen. Since then, markets have traditionally “underestimated” the factor of military conflicts in the Middle East (they barely “noticed” the second Iraq war).
So, as matters stand, global financial markets are feeling a degree of pessimism, but are not preparing for a deep fall. Yet a crash will inevitably occur if the war with Iran drags on for more than 90 days and markets come to understand that it is here for the long haul. In that case, the depth of the collapse could amount to between 10 and 20 percent.
Naturally, against a backdrop of inflation expectations, the Federal Reserve will no longer cut its benchmark rate to zero or implement programmes of quantitative easing — that is, money-printing. The US simply has no money for a new economic stimulus programme on the scale of CARES. The United States has no money for a new large-scale crisis at all.
The global crisis of 2008 and the pandemic of 2020 exhausted those reserves.
ВАС ЗАИНТЕРЕСУЕТ
Therefore, in the event of a new global crisis, there will be the “creative destruction” anticipated by libertarians in Schumpeter’s sense, along with a positive “industrial mutation.”
Demand for alternative energy sources will rise; the world will see a renaissance in nuclear power generation and a surge of investment in new nuclear fusion technologies.
Demand for electric vehicles will increase, to China’s advantage—just as the Japanese small car benefited from the oil crisis of the 1970s.
If in the 1970s this ended in a crisis for the American car industry, now an analogous crisis will confront car manufacturing in the EU.
A prolonged spell of high oil prices, if the war in Iran lasts for more than six months, will bring a significant number of difficult oilfields back into production, including in the Arctic and Latin America. And the real test of systemic resilience awaits the European Union.
Noticed an error?
Please select it with the mouse and press Ctrl+Enter or Submit a bug
Stay up to date with the latest developments!
Subscribe to our channel in Telegram
Пожалуйста выберите один или несколько пунктов (до 3 шт.) которые по Вашему мнению определяет этот комментарий.
Пожалуйста выберите один или больше пунктов
Нецензурная лексика, ругань
Флуд
Нарушение действующего законодательства Украины
Оскорбление участников дискуссии
Реклама
Разжигание розни
Признаки троллинга и провокации
Другая причина
Отмена
Отправить жалобу
ОК

 Login with Google