


Groundhog Day: Can Ukraine’s Economy Grow Without Rollbacks?


In historical hindsight, one of the factors behind the failure of Ukraine’s economic model is the absence of a clear focus and correct, locally adapted settings.
What, then, are the main causes of these errors? Let us try to find an answer by assessing the main parameters of potential development models.
First of all, we will single out the key criteria for our assessment, since in some analytical materials, especially official ones, Ukraine’s development in the period predating the full-scale war was described as quite successful.
However, the criteria of success of an economic model for a developing country are the following:
- GDP growth rates at the level of 5 percent per year or more;
- a trade surplus or minimal deficit;
- steady progress of GDP toward the 1-trillion-dollar mark in nominal terms;
- absence of labor migration from the country;
- a high level of investment in the national economy—a negative net international investment position at the level of 90 percent of GDP or higher (primarily due to private investment).
Now let us evaluate the pre-war Ukrainian economy based on these criteria.
After 2010, the growth rates of Ukraine’s economy (except for certain periods of post-crisis recovery) were moderate—at the level of 2–3 percent per annum. This is a sufficient level for an advanced country but not for a developing one.
Only GDP growth rates above 5 percent per year allow a poor economy to reduce poverty and catch up with the wealthy Western nations.
In addition, in poor countries the inflation rate is higher than in developed ones; therefore, the exchange rate instability of the national currency periodically devalues the dollar equivalent of GDP.
In recent years, Ukraine has always run a trade deficit. For example, in 2019 it reached minus $12.5 billion (the balance of trade in goods and services), or 6.25 percent of gross product (excluding the period of the full-scale war).

Historically, Ukraine’s GDP growth has experienced a kind of a “Groundhog Day,” when the economy keeps going in an enchanted circle with a conditional radius of gross product amounting to $200 billion.
For the first time we came closest to this mark in 2008, with a GDP of almost $180 billion, but that growth was cut short by the Global Financial Crisis.
The second time we approached the $200 billion mark was in 2013, with a GDP of $183 billion, but we lost those gains in 2014–2015.
In 2021, due to post-pandemic inflation and higher commodity prices, our GDP finally increased to $200 billion, but growth was stopped by Russia’s full-scale invasion.
The fourth attempt may occur in 2025. According to various estimates, this year’s GDP will amount to $200 billion. But there is a caveat…
Each time after such growth our GDP saw a “downward adjustment” to lower values, primarily under the influence of external circumstances. After 2008, it decreased to $117 billion in 2009; after 2013, a reduction to $90 billion occurred in 2015; and after 2021, we saw a decline to $162 billion in 2022.
Of course, time will tell how our GDP evolves in 2026, but it seems likely that another adjustment will occur.
What are the main reasons for the growth of GDP in dollar terms during the full-scale war? Especially given that in 2022 real GDP in hryvnias collapsed by 28 percent, and the deficit in trade in goods is now approaching $40 billion dollars per year.
The first reason is the massive inflow of external financial and technical assistance, amounting to about $40 billion, or more than 20 percent of GDP annually.
The second one is the significant impact of government spending, particularly in the defense sector.
The third reason is the artificial stability of the hryvnia, maintained through that same external assistance. After all, the dollar equivalent of GDP is obtained by dividing nominal GDP in hryvnias by the average annual exchange rate of the hryvnia to the dollar.
Nominal GDP during the war has risen sharply due to the deflator—i.e., the inflation index. Here are some numbers to illustrate the point: in 2021, Ukraine’s nominal GDP amounted to UAH 5.5 trillion, while in 2026 it is expected to reach UAH 10.4 trillion, which is nearly twice as much. This increase is driven primarily by inflation rather than real growth.
Given that all previous “adjustments” resulted from external shocks, could Ukraine’s economy have progressed toward the one-trillion-dollar GDP target on the strength of its raw-material “engine” had those shocks not taken place?
An additional factor revealing the flaws of our development model is the constant loss of human capital through labor migration. In other words, our economic model has failed to provide the economically active population with enough well-paid jobs. Even before the full-scale war, the number of Ukrainian labor migrants abroad reached 4–5 million people (including circular migration).
Bearing in mind that high wages stem from the level of value added and that value added in turn depends on economic complexity, let us try to identify that very bifurcation point.

Ukraine’s export indicators can be grouped as follows:
- industrial exports: industrial goods, chemical products, ferrous metallurgy, machinery, transport equipment, machine tools, instruments and other goods;
- agricultural and raw-material exports: food products, timber and mineral raw materials (primarily iron ore).
Whereas in 2005 the first group accounted for 71 percent and the second group for 29 percent of total exports, by 2021—on the eve of the full-scale war—the share of the first group had fallen to 40 percent and that of the second had risen to 60 percent.
In essence, the national economy underwent a kind of structural inversion—a complete “turnaround.”
During the war, this ratio shifted even further: now it stands at roughly 25 to 75 in favor of the second group.
In absolute terms, industrial exports have shrunk from $23 billion per year to $9.8 billion—down by a factor of 2.3. At the same time, agricultural and raw-material exports have risen from $9 billion to $29 billion—a 3.2-fold increase.
The intensification of these transformations during the full-scale war makes Ukraine’s experience of structural change unique: in most countries at war the commodity-based and service sectors grow more slowly than the industrial sector, which is usually sustained by government orders and the defense industry.
The strengthening of the commodity-and-service component in our export structure instead points to further deindustrialization.
Therefore, the triumphant rhetoric of our government about the development of the defense industry can be taken only with a grain of salt: in the history of world industrial development, there has not been a single example of military production expanding against the backdrop of deindustrialization and an “industrial desert.” That is a priori impossible.
The bifurcation point in the structure of our exports happened in 2015. It was the first year when the share of the second group of goods exceeded that of the first. This occurred as a result of the partial destruction of the integrated Donetsk–Dnipro industrial region, primarily due to the war and the occupation of part of Donbas.
However, as can be seen in Figure 1, the preconditions for this had begun to take shape back in 2011, when the Party of Regions and Viktor Yanukovych were in power.
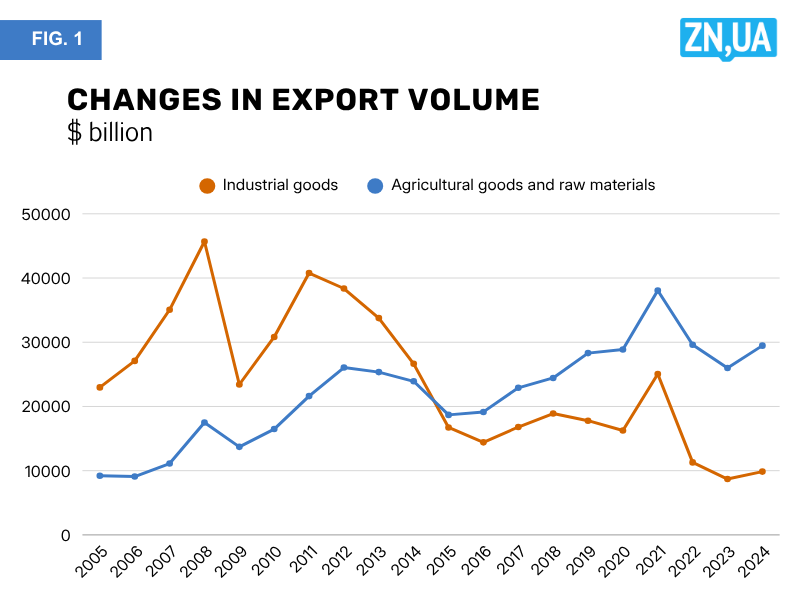
In other words, war does not create new trends but rather intensifies and multiplies existing ones. The shift in the structure of exports would have happened even without the war, possibly ten years later.
This once again shows that, at the political level, the correlation between the rise to power of particular groups within the ruling class and the format of the underlying economic model was, in a certain sense, a myth.

Another important indicator is the country’s net international investment position (NIIP), the difference between its assets (funds invested by the country in the global economy) and its liabilities (funds invested by the global economy in the country) (see Figure 2).
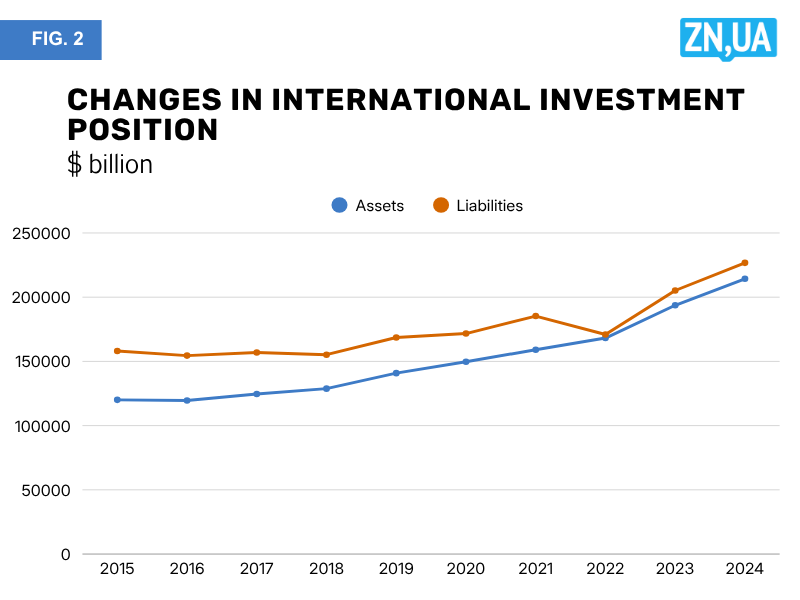
This is one of those unique cases where a negative value for a dynamically developing country is actually a positive sign, as it shows that inflows of international capital exceed domestic outflows—provided, of course, that these are primarily direct investments rather than just loans.
In 2015, Ukraine’s NIIP stood at minus $38 billion, or 43 percent of GDP.

From then on, this figure gradually moved toward zero, reaching its highest point in 2023 under the influence of the shocks of war. In 2024, the figure amounted to minus 12.5 billion dollars, or 6.57 percent of GDP.
Thus, since 2015, Ukraine’s economy has been rapidly losing investment appeal: there is an inflow of external capital, but the outflow of domestic capital exceeds it, effectively “devouring” the indicator of the net international investment position.
Ukraine is gradually turning into a platform for making quick money on agricultural and mineral raw materials whilst also becoming one of the regional centers of private capital outflow abroad.
Now let us return to the development models.
The complex economy model means, first and foremost, the growth of economic complexity, that is, of industry along the value-added chain. But this requires the ability to protect one’s internal market and to help national businesses capture foreign markets.
This is achieved, among other things, through state incentives for complex, non-commodity exports (for instance, by providing credit to foreign buyers of such complex products).
In Ukraine, however, the state-owned Ukreximbank, instead of financing export operations for its clients, lends money for dubious deals involving the purchase of shopping and entertainment centers in Kyiv. Before the war, it was buying bonds of the State Agency of Automobile Roads (Ukravtodor) to fund the president’s Great Construction program.
Worse still, even our commodity-based economic model is not properly calibrated. Among its shortcomings is a very low level of GDP inclusivity for broad segments of the public.
Simply put, the “profit” of such an economy ends up in the pockets of a few raw-material financial-industrial groups and transnational corporations without reaching the masses.
The only possible tool for such GDP inclusivity could be a National Sovereign Reserve Fund, which would accumulate resource rent and export duties on raw materials.

The fund’s resources could then be used either for structural transformation of the economy toward higher value-added sectors (a raw-material dependency that defeats itself) or distributed into personal accounts of Ukrainian citizens as a kind of “republican share.”
Since 2005, the total volume of agricultural and raw-material exports has amounted to $440 billion, while the economically justified rent could have reached $60 billion over 20 years.
Even minimal export duties of 5 percent, combined with rent accumulation, would have allowed such a fund to amass up to $80 billion, or about 2,000 dollars per every Ukrainian citizen. Taking into account returns from investment, this sum could have grown to 5,000 dollars per person over ten years.
If the “republican share” had been applied only to newborn Ukrainians from a certain date, the redistribution amount could have increased severalfold.
However, Ukraine has neither such a reserve fund nor a system of export duties on raw materials. Moreover, the size of the resource rent itself is significantly understated.
The commodity-based model also has its own “speed limiter”: unlike complex industrial exports, commodity exports do not generate increasing returns on capital and are subject to physical limits of growth, measured in tons, cubic meters, bushels or barrels.
Let us look at the level of economic complexity and export indicators in several countries:
Türkiye—$256 billion of exports, $1.12 trillion GDP, exports-to-GDP ratio at 23 percent;
Poland—$354 billion of exports, $0.91 trillion GDP, 38 percent ratio;
South Korea—$632 billion of exports, $1.713 trillion GDP, 37 percent ratio;
Argentina—$66 billion of exports, $0.65 trillion GDP, 10 percent ratio;
Ukraine (2021)—$56 billion of exports, $0.2 trillion GDP, 28 percent ratio.
Thus, an increase of Ukraine’s GDP on a raw-material basis will also stimulate import growth, primarily of consumer goods. The rise in imports, in turn, requires a proportional increase in exports. Yet raw-material exports face a physical ceiling: once that ceiling is reached, export growth halts while imports continue to rise, thereby expanding the trade deficit.
Up to a certain point, within the balance of payments, this trade “minus” can be offset by loans and labor remittances, but once it exceeds the critical threshold of 10 percent of GDP, the said speed limiter comes into play: the devaluation of the hryvnia.
As a result, the dollar equivalent of GDP is adjusted downward, wiping out several years of growth.
For a commodity economy, this is a built-in condition—a perpetual “Groundhog Day” that can be broken only by transitioning to more complex export models, which would allow Ukraine to export not $50 billion worth of goods a year, but—like Türkiye or Poland—$250–350 billion (a commodity-based export of that scale is obviously beyond Ukraine’s reach at current prices).

With such a structure, Ukraine’s GDP could rise to $0.7–1 trillion, making it possible to sustain annual defense spending of about $50 billion in peacetime, without external aid.
Otherwise, Ukraine will remain trapped in what economists call the poverty trap:
- underdeveloped infrastructure;
- corruption;
- capital flight;
- wars;
- lack of access to credit;
- environmental degradation;
- a crisis of education and healthcare systems.
An agro-based and resource-driven development model, especially one without a system of export duties or a reserve fund, creates the perfect environment for a rent-seeking, extractive and corruption-laden economic system.
In such a system, rent becomes the building material for the “cells” of corruption, oligarchy and their political clientele—that is, for a caste-based society. It provides a perfect breeding ground for the virus of corruption, just as damp near-freezing winter weather does for an influenza epidemic.
Please select it with the mouse and press Ctrl+Enter or Submit a bug
 Login with Google